Data stories
that find you
AI-generated visual insights delivered as a scrollable feed. Every morning, the metrics that matter: animated, narrated, and ready in 60 seconds.
How did revenue close in February?
Click to interact
From warehouse to morning feed
nudged connects to your existing data stack and transforms raw metrics into narrated visual stories, automatically.
Connect
Link your data sources like Snowflake, dbt, BigQuery, Google Sheets, and more. Import existing semantic models so nothing gets redefined.
Detect
Our intelligence engine scans your metrics overnight, finding anomalies, trends, and noteworthy changes. If nothing interesting happened, silence.
Deliver
Every morning, a curated feed of animated insight cards lands on your phone. Scroll through them in 60 seconds like short-form content.
Explore
Tap any insight to open an AI chat. Ask follow-up questions, slice by dimensions, and drill into the story behind the numbers.
Five phases. One story.
Every nudge is a structured narrative that auto-plays through five phases, building understanding from hook to insight.
Something unusual happened with revenue this week...
Tap to skip or wait for auto-play
Every insight, perfectly packaged
Scroll your metrics like a morning feed
Each nudge plays through five phases: a contextual hook, the key metric, an animated chart, a comparison, and an AI-written takeaway. Full-screen, one-handed, designed for your commute.
Sales Pipeline
Revenue hit a new monthly high
Enterprise renewals and 3 new mid-market deals drove your best month ever.
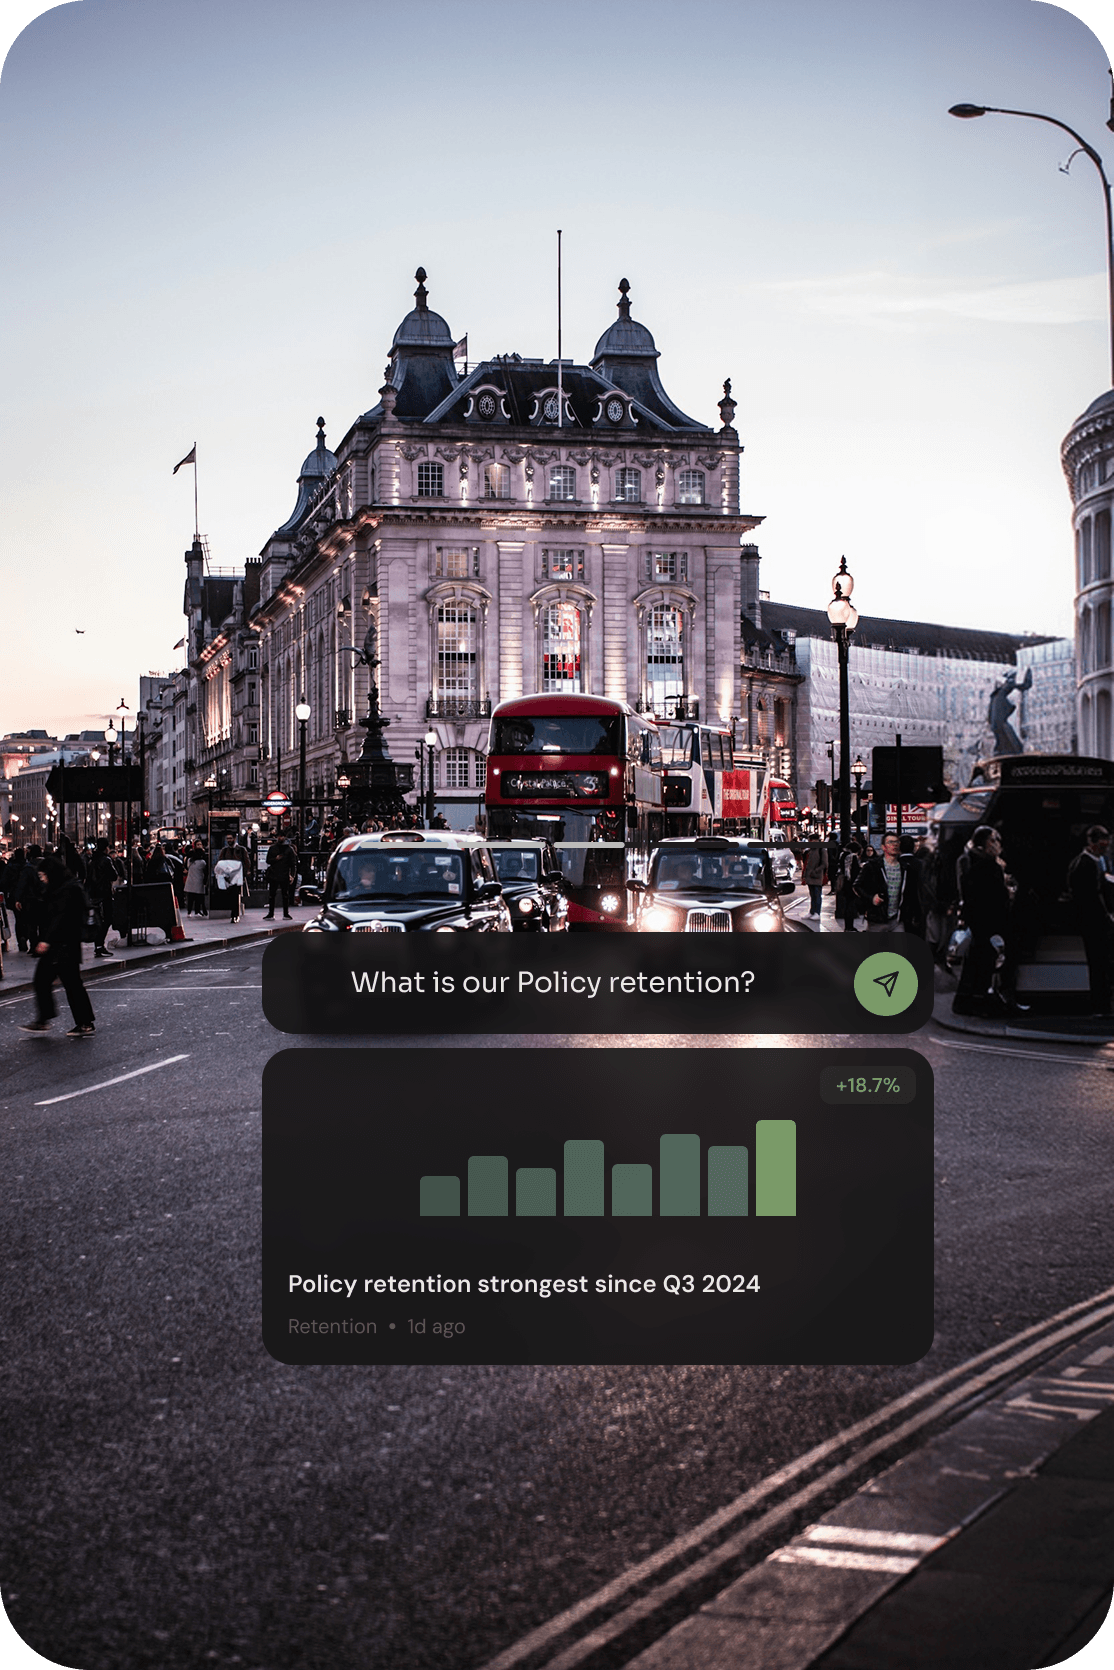
Ask questions, get answers
Tap any nudge to open a conversational AI that understands your data context. Slice by region, compare time periods, or ask “why?”
Three enterprise deals closed early. EMEA accounted for 68% of the increase.
Revenue by Region
EMEA beat forecast by 14.2%. This is the 3rd consecutive quarter above plan, driven by the Acme Corp renewal ($420K) and two new logos.
Gets smarter with every signal
The engine continuously learns from your semantic layer definitions, metric relationships, user feedback, and team engagement patterns. It absorbs context from every source to surface what actually matters, and stays quiet when it doesn't.
Semantic Layer
1,240 definitionsdbt models, metric definitions, relationships
Warehouse Metadata
847 metricsSchema changes, query patterns, freshness
User Feedback
3.2K interactionsLikes, saves, dismissals, explore depth
Team Engagement
64 active usersShare rates, explore follow-ups, builder usage
Domain Context
8 domainsBusiness logic, KPI hierarchies, seasonality
Create your own nudges
Team leads can build custom insight cards in four steps. Choose metrics, configure the display, let AI co-author the narrative, then publish to your team's feed.
Selected Metric
Monthly Active Users
“Monthly active users climbed to 14.2K, up 8.7% from last month. Growth accelerated after the onboarding redesign shipped in week 2, with Day-7 retention improving 12 points.”
Full control, zero friction
Manage connections, review imported metrics, organize into domains, and control permissions. A guided wizard walks you through setup in minutes.
Domains
Connects to the stack you already use
Import semantic models from dbt, Looker, or Omni. Connect directly to your warehouse. Or plug in a spreadsheet. nudged meets you where your data lives.
Data Warehouses
Semantic Layers
BI Tools
Business Apps
Data Catalogs
Collaboration
Loved by data-driven teams
“nudged replaced my morning dashboard ritual. I get more context in 60 seconds of scrolling than 10 minutes of clicking through Looker.”
Sarah Chen
VP of Revenue, Meridian SaaS
“Our sales team actually looks at data now. The feed format is something they already understand. It just works.”
Marcus Thompson
Director of Analytics, Clearpath
“The silence feature is genius. When I get a nudge, I know it matters. No more alert fatigue.”
Priya Sharma
CS Lead, Relay
Your metrics, in your pocket
Get nudged on your phone and scroll through your morning insights on the go. Available on iOS and Android.
Your data,
delivered daily
nudged turns your business metrics into bite-sized visual insights — delivered fresh to your feed every morning.
I already have an invite
Your metrics, wherever you are
From the boardroom to the marina — nudged delivers your morning insights anywhere in the world.


Simple, transparent pricing
Start free. Scale as your team grows. No surprise bills, no hidden fees.
Starter
For small teams getting started with data insights.
- Up to 3 users
- 2 data source connections
- 50 nudges per month
- Basic Explore (10 queries/day)
- Creator connectors (Sheets, CSV)
- 7-day insight history
Team
For growing teams that need the full nudged experience.
- Up to 50 users
- Unlimited connections
- Unlimited nudges
- Full Explore with drill-downs
- Nudge Builder & templates
- 90-day insight history
- Group permissions
- Push notifications
- Priority support
Enterprise
For organizations with advanced security and scale needs.
- Unlimited users
- SSO & SAML
- Row-level security
- Custom data retention
- Dedicated infrastructure
- SLA guarantees
- Custom connectors
- Onboarding & training
- Account manager
Your data has stories.
Start listening.
Join teams who've replaced their morning dashboard ritual with a 60-second scroll. Free for up to 3 users, no credit card required.